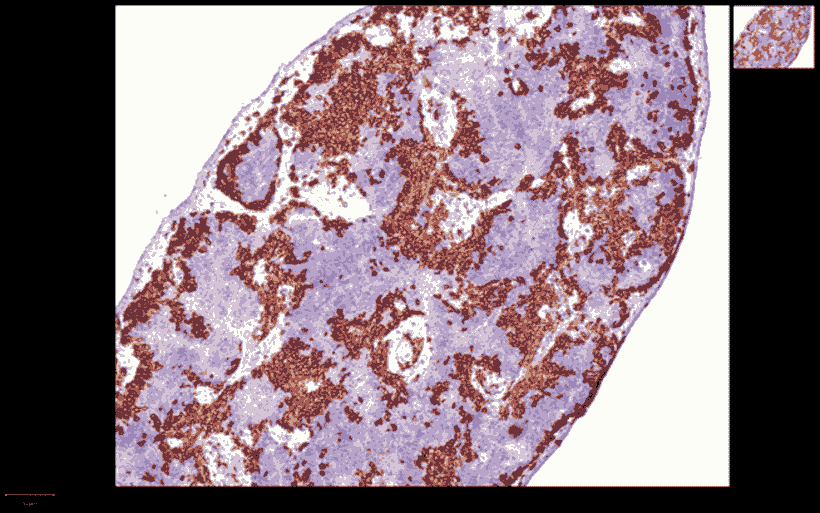
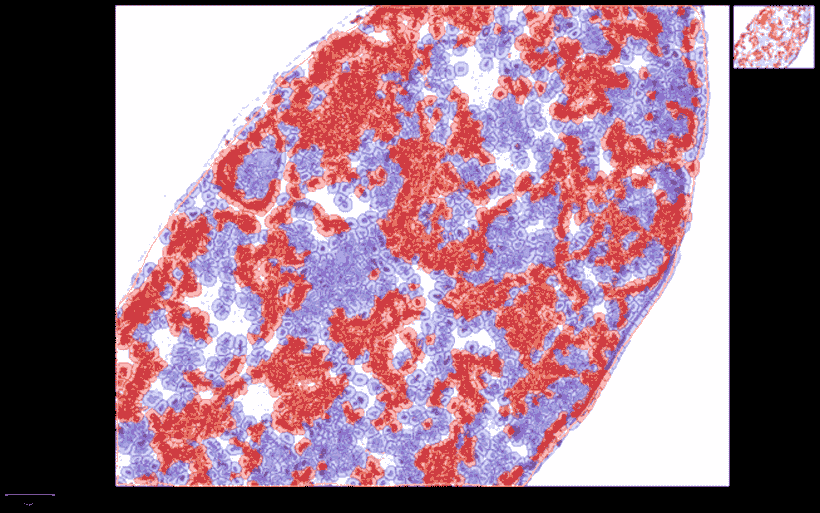
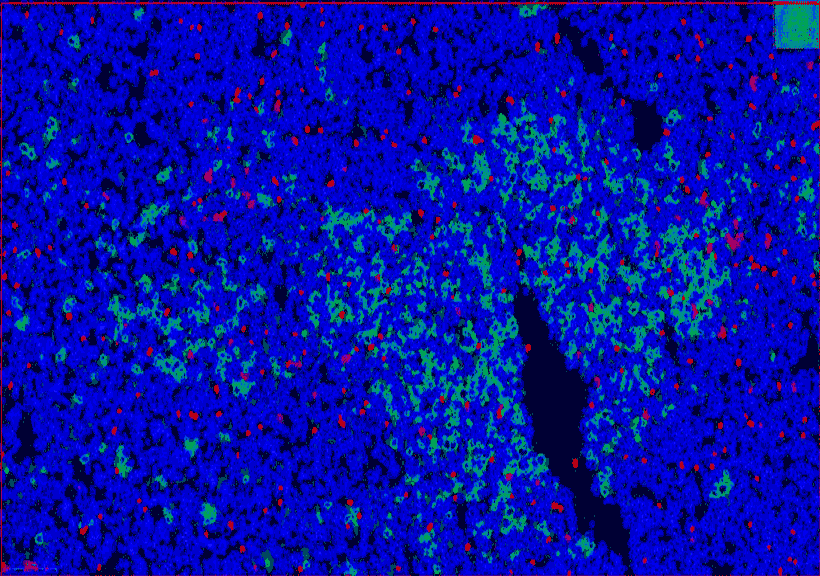
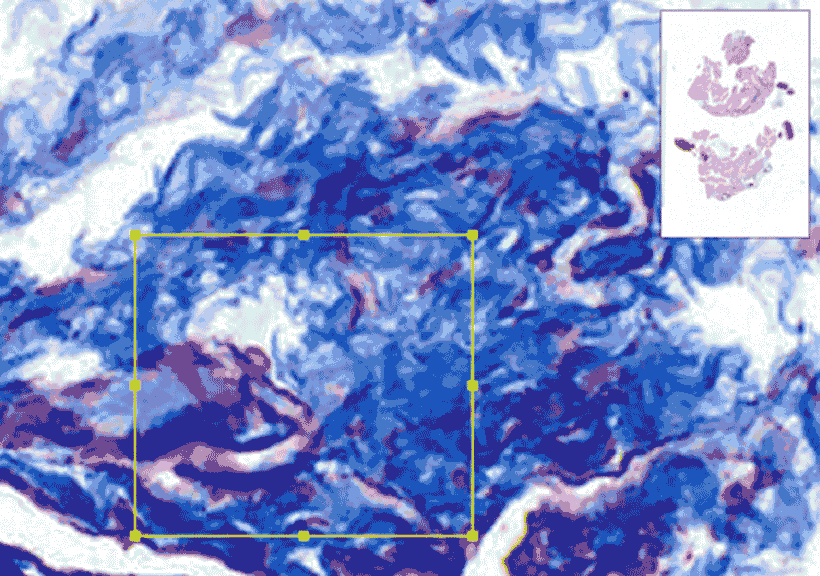
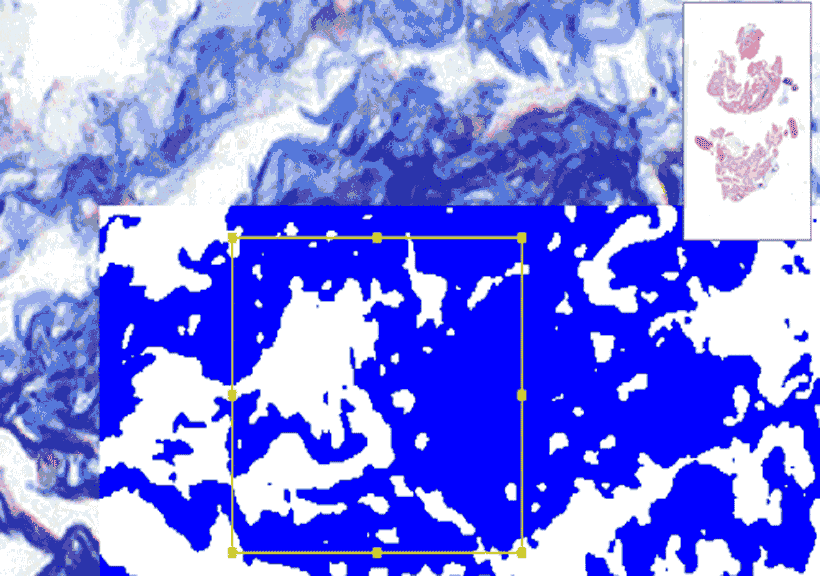
Our goal is your 100% satisfaction!

Both brightfield and fluorescence images can be analyzed and quantified by APS scientists so that the quantitative data can be used to directly compare between different groups. We can either scan the stained tissue in whole slides, take representative images from your study, or use the images you provide for the quantitative analysis.


Cell Segmentation

Spatial Analysis

Pixel Classification

Object Measurement

Positive cell detection: quantify the signal intensity and define the positive cells in ROIs or whole slide

  • Quantify the positive cell number and the percentage among the whole cell population
  • Quantify the subclasses of positive cells with different expression level

CD-45 IHC Staining in Mouse Spleen
Quantification CD-45 (+) cells in Mouse Spleen
Cell detection

Co-expression detection: quantify the expression of multiple markers in a single cell level

  • to classify different cell types
  • to quantify the level of co-expressed and co-localized
  • Exported data includes percentage of positive cells, percentage of co-expression in total cell population of a classified subgroup of cells in addition to the parameters mentioned in positive cell detection for each marker

Co-expression of CD-8 and Ki-67

Subcellular signal detection: quantify the signal intensity in different subcellar compartments, such as nucleus and cytoplasm

  • to classify different cell types
  • to determine the whether the markers are co-expressed and co-localized
  • common parameters of the exporting data includes percentage of positive cells, percentage of co-expression in total cell population of a classified subgroup of cells in addition to the parameters mentioned in positive cell detection for each marker

Subcellular IHC signal of CD-8 and Ki-67

Cell Segmentation

Spatial Analysis

Pixel Classification

Object Measurement

Quantify the spatial relationship in a tissue microenvironment between two classified cell types, or between one cell type to a specific molecule.

Original Multiplexed IHC Image
Nearest CD-68 (+) cells of each CD-20 (+) cells
Nearest PD-L1 (+) cells of each Ki-67 (+) cells

Cell Segmentation

Spatial Analysis

Pixel Classification

Object Measurement

Classification of pixels as negative or positive

Cell Segmentation

Spatial Analysis

Pixel Classification

Object Measurement

Working together with pathologists, APS scientists can measure the distance and size of damage or specific disease area using different software.

The length or depth of a wound
The size of germinal center of mouse spleen
The area of a wound
The size of mouse colon polyps
The angle of a wound
The size of necrosis in mouse liver